
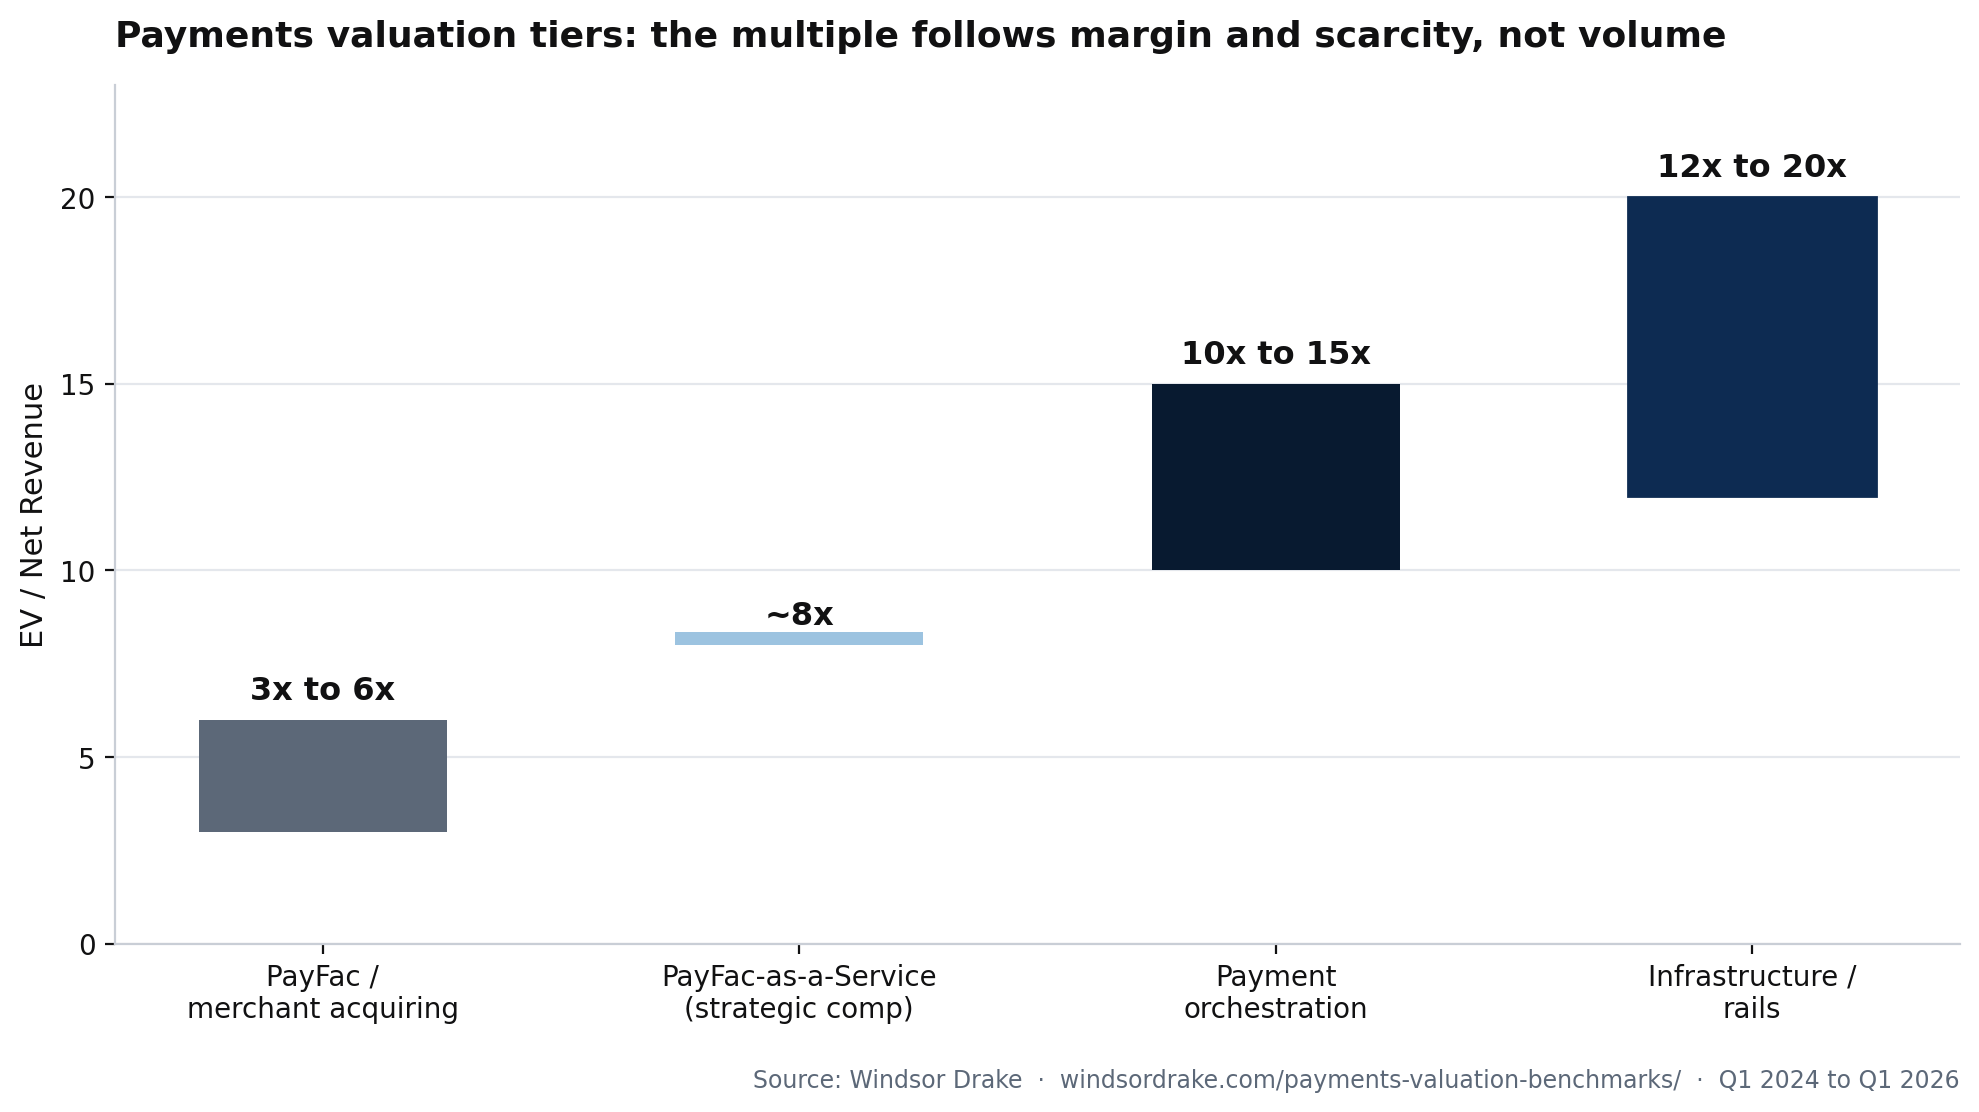
Lower middle market payments companies trade in three tiers on retained net revenue: PayFac and merchant acquiring at 3x to 6x, payment orchestration at 10x to 15x, and infrastructure and rails at 12x to 20x. Mature, profitable processors and infrastructure assets trade at 10x to 18x EBITDA and above. The spread is set by gross margin, liability exposure and scarcity, not by payment volume.
Compare PayFac and merchant acquiring, PayFac-as-a-Service, orchestration and infrastructure on EV/net revenue; plot the public constituents by EBITDA margin against EV/EBITDA with a sortable table; read retained take rate against gross capture in basis points; and see each disclosed deal with its stated basis. Revenue here means retained net revenue, never payment volume.
The interactive explorer loads here. The default view is published below so the numbers are readable without JavaScript.
Payment orchestration, EV / net revenue: 10x to 15x. Windsor Drake, Payments Valuation Benchmarks (updated 11 Aug 2026); public comps via stockanalysis.com (S&P Global) 8-11 Aug 2026; HL Q1 2026 FinTech update (retrieved 2026-09-22): lower-middle-market ranges by business model, stated against net revenue (after interchange and network pass-through). Analyst ranges, not sample quartiles. Mature profitable processors and infrastructure assets: 10x-18x EBITDA and above.
| Model | EV/net revenue | Gross margin profile | What sets the multiple |
|---|---|---|---|
| PayFac / merchant acquiring | 3.0x-6.0x | 40-60% gross margin (capped by interchange) | Net revenue quality, vertical depth, churn |
| PayFac-as-a-Service | ~8.0x | Software margin on 20-40 bps net take | Platform embed depth, ISV distribution |
| Payment orchestration | 10.0x-15.0x | 70-85% gross margin | Processor-agnostic position, authorization-rate lift, NRR |
| Infrastructure / rails | 12.0x-20.0x | 70%+ gross margin | Direct network connectivity, scarcity, low liability |
Benchmark version 2026.09.22-1. Sources: Windsor Drake payments benchmarks (Aug 2026); stockanalysis.com (S&P Global) 8-11 Aug 2026; Houlihan Lokey Q1 and Q2 2026; disclosed deal announcements.
Lower middle market payments companies trade in three tiers: PayFacs at 3x to 6x net revenue, orchestration platforms at 10x to 15x, and infrastructure and rails businesses at 12x to 20x. The spread is driven by gross margin, liability exposure, and scarcity, not volume. Window: Q1 2024 through Q3 2026. Refreshed quarterly.
| Model | EV / Revenue | Gross Margin Profile | What Sets the Multiple |
|---|---|---|---|
| PayFac / merchant acquiring | 3x to 6x | 40 to 60 percent (capped by interchange) | Net revenue quality, vertical depth, churn |
| Payment orchestration | 10x to 15x | 70 to 85 percent | Processor-agnostic position, auth-rate lift, NRR |
| Infrastructure / rails | 12x to 20x | 70 percent plus | Direct network connectivity, scarcity, low liability |
| PayFac-as-a-Service | ~8x (recent strategic comp) | Software margin on 20 to 40 bps net take | Platform embed depth, ISV distribution |
On EBITDA, mature profitable processors and infrastructure assets trade at 10x to 18x and above, with the Rule of 40 (growth plus profitability above 40 percent) acting as the valuation floor test buyers actually apply.
Cite this report
Windsor Drake, "Payments and PayFac Valuation Benchmarks" (2026), https://windsordrake.com/payments-valuation-benchmarks/
Every multiple in this report is stated against net revenue unless marked otherwise. This is the single most common source of confusion in payments valuation. A PayFac reporting 2.9 percent gross capture surrenders 1.8 to 2.2 percent to interchange before earning anything; its economic revenue is the net spread, and applying an orchestration-tier multiple to its gross line overstates value by multiples of the real answer. Conversely, orchestration and infrastructure businesses book revenue that is already net, at 70 to 85 percent gross margins, which is precisely why their revenue multiples run two to four times higher. When comparing offers or comps, confirm which revenue line the multiple references before comparing anything else.
| Metric | Target | Impact on Multiple |
|---|---|---|
| Net revenue retention | Above 110 percent | Very high |
| Gross margin | Above 70 percent | Very high |
| Take rate durability | Stable or increasing | High |
| Customer churn | Below 5 percent annually | High |
| Cohort profitability | Positive by month 12 | Moderate |
| Customer concentration | Top 10 below 30 percent | Moderate |
Typical PayFac gross capture runs near 2.9 percent of volume, with interchange consuming 1.8 to 2.2 percent, capping gross margins at 40 to 60 percent. PayFac-as-a-Service providers net 20 to 40 basis points on embedded volume. Every 10 percent of volume that shifts from debit to rewards credit costs roughly 15 to 20 basis points of net margin, a mix-shift risk buyers now model explicitly. Orchestration platforms, by contrast, run 70 to 85 percent gross margins and can document authorization-rate improvements of 2 to 5 percent, which is the operating metric their premium actually rests on. Transaction-linked revenues across the industry are growing about 6 percent annually against under 3 percent for non-transactional revenue.
Public comps frame the private bands, and the spread is wide. On August 2026 trailing data, Adyen traded at 7.9x EV/Revenue on a 53 percent EBITDA margin while Euronet traded at 0.75x, roughly a tenfold spread inside one sector. Part of that gap is accounting rather than quality. Adyen reports net revenue while Shift4, Toast, and Block report gross revenue including pass-through interchange, which is why Shift4 screens at 1.6x. Restate Block against its own disclosed gross profit and the multiple moves from 1.9x to about 4.1x. The margin hierarchy does the rest: the 50 percent margin names, Adyen and Corpay, carry 13x to 15x EV/EBITDA, the at-scale processors in the 34 to 38 percent margin band, Fiserv, FIS, and Global Payments, trade at 7x to 11x, and distress compresses multiples regardless of scale, with Worldline below 1x revenue after a 93 percent share decline.
| Company | EV / Revenue (LTM) | EV / EBITDA (LTM) | EBITDA margin |
|---|---|---|---|
| Adyen (net revenue reporter) | 7.9x | 15.1x | 53% |
| Corpay | 6.8x | 13.0x | 53% |
| Jack Henry | 4.4x | 12.9x | 34% |
| Global Payments | 4.0x | 10.9x | 37% |
| FIS | 3.5x | 10.2x | 34% |
| Fiserv | 2.6x | 6.9x | 38% |
| Shift4 (gross revenue reporter) | 1.6x | 8.3x | 19% |
| Euronet | 0.75x | 5.0x | 15% |
Data: stockanalysis.com (S&P Global), trailing twelve months as of August 8 to 11, 2026. These are GAAP-basis trailing multiples; deal multiples quoted on adjusted EBITDA run lower for the same company. For published forward medians, Houlihan Lokey’s Q1 2026 FinTech update puts the payments sector at 2.1x EV/Revenue and 6.9x EV/EBITDA on 2026 estimates, with merchant acceptance at 2.3x and 6.5x and B2B payments at 3.4x and 10.0x.
Most payments deals never publish a price. Of the 36 deals The Strawhecker Group counted in the first half of 2026, only 11 disclosed terms. The table below is limited to transactions where the value is public, and multiples appear only where the acquirer stated them or where they compute from disclosed figures, in which case they are labeled computed.
| Transaction | Announced | Value | Multiple | What it marks |
|---|---|---|---|---|
| Global Payments acquires Worldpay | Apr 2025 (closed Jan 2026) | $24.25B | 8.5x adj. EBITDA net of synergies, stated | At-scale merchant acquiring |
| FIS acquires GPN Issuer Solutions | Apr 2025 (closed Jan 2026) | $13.5B | 12.3x adj. EBITDA, stated | Issuer processing premium over acquiring |
| Advent takes Nuvei private | Apr 2024 (closed Nov 2024) | $6.3B | ~5.3x revenue, ~14.4x adj. EBITDA on FY23 figures, computed | Scaled ecommerce processing |
| Nuvei acquires Payoneer | Jun 2026 | $2.75B | Not disclosed | Cross-border consolidation |
| Shift4 acquires Global Blue | Feb 2025 | ~$2.5B EV | ~12x to 13x guided adj. EBITDA, computed | Specialty payments scarcity |
| Corpay acquires Alpha Group | Jul 2025 (closed Nov 2025) | $2.4B at close | Not disclosed | Corporate cross-border FX |
| TPG and Corpay take AvidXchange private | May 2025 | $2.2B | ~5.0x FY24 revenue, computed | AP automation |
| Mastercard acquires BVNK | Mar 2026 (closed Aug 2026) | Reported up to $1.8B | Not disclosed | Stablecoin settlement rails |
| Stripe acquires Bridge | Closed Feb 2025 | $1.1B | Strategic | Stablecoin infrastructure |
| Deluxe acquires Celero Commerce | Jun 2026 | $625M | ~3.1x revenue, ~11x adj. EBITDA, computed from disclosed $200M revenue at a 28% margin | SMB acquiring consolidation |
| Western Union acquires Intermex | Aug 2025 | ~$500M | Not disclosed | Remittance consolidation |
| Repay acquires Kubra | Mar 2026 | $372M | Not disclosed | Consumer bill-pay verticals |
| Flywire acquires Sertifi | Feb 2025 | ~$330M | Not disclosed | Vertical software with payments |
| Euronet acquires CoreCard | Aug 2025 | ~$248M stock | Not disclosed | Issuer processing tuck-in |
The buyer map churned hard through 2025 and 2026, and a list from even a year ago misleads. Global Payments and FIS are integrating the largest deals in their histories and divesting rather than hunting. The reliable bidders in the $5 million to $300 million band are the sponsor-backed consolidators and Shift4, with Fiserv still writing $50 million to $500 million tuck-in checks and Deluxe arriving as a new strategic through its $625 million Celero agreement.
| Buyer | What they buy | Recent evidence |
|---|---|---|
| Payroc (Parthenon Capital) | ISO books, residual portfolios, orchestration | BlueSnap, LedgerPay, i3 Verticals merchant unit; 17 acquisitions |
| Fortis (Audax, Lovell Minnick) | Embedded and ERP payments | Serve First, Payment Logistics, MerchantE NetSuite division; 2025 recap raised to fund M&A |
| Fullsteam (Aquiline, ADIA, Sixth Street) | Vertical software with payments attached, sub-$50M | Serial acquirer |
| Stax (Greater Sum Ventures) | Stack ownership | BlockChyp |
| Xplor (Advent) | Vertical SaaS with recurring payments | Ezypay; Clubessential merger |
| Shift4 | Merchant relationships priced per merchant, not on EBITDA | Global Blue ~$2.5B; Smartpay ~US$180M; ~300 deals evaluated in 2024, 5 closed |
| Fiserv | Clover geography and capability, $50M to $500M | Payfare C$201.5M, CCV, Pinch, Money Money |
| Deluxe | SMB acquiring scale | Celero Commerce, $625M |
| Corpay | Corporate cross-border FX and AP | Alpha Group $2.4B; AvidXchange minority |
| Euronet | Issuing and money movement, $100M to $1B | CoreCard ~$248M |
Behind them sits refreshed sponsor capital. GTCR exited Worldpay at roughly two times its money in about two years, FTV Capital closed a record $4.05 billion raise in January 2025, and Great Hill Partners raised $7 billion. In this band the constraint is not buyer demand but diligence: The Strawhecker Group’s 2026 annual letter describes payments M&A in a more disciplined phase, where the portfolios that stand out are not the biggest but the cleanest.
Straight portfolio and residual sales do not price on EBITDA multiples at all. The published convention is a multiple of net monthly residuals, and the current guidance from portfolio advisory 733Park runs 28x to 46x monthly residuals: roughly 40x to 46x for portfolios with annual attrition under 7 percent on premium processors, 36x to 42x in the 7 to 12 percent band, 30x to 36x at 12 to 18 percent, and 28x to 30x for distressed books, with sub-ISO arrangements discounted a further 15 to 30 percent. Attrition is the swing variable and it is strongly size-dependent: The Strawhecker Group’s benchmarks put annual attrition near 21 percent for merchants under $250,000 in card volume against roughly 10 percent for merchants processing $1 million to $10 million. Two books with identical residual lines can differ by half in price on attrition and portability alone, which is why portfolio buyers open diligence with the merchant tape rather than the income statement.
Embedded payments are compounding at 30.3 percent annually through 2032, with embeddedness treated as proven once install-base adoption passes 40 percent. B2B payments remain the largest underpenetrated pool: a $135 trillion flow of which only 7 to 10 percent is digitized, with automation cutting processing costs 25 to 30 percent and B2B customer lifetime values running 3 to 4 times consumer fintech. The orchestration market itself is projected to grow from $1.8B in 2025 to $13.4B by 2034. On the regulatory side, US money transmitter license approval timelines have compressed roughly 35 percent, and stablecoin legislation has added a premium of about 25 percent to stablecoin-adjacent infrastructure since September 2025. AI-enabled payments capabilities carry a 20 to 30 percent premium in current processes.
Multiples reflect disclosed transaction data, public comparables, and Windsor Drake analysis for the Q1 2024 through Q1 2026 window, with sources including Goldman Sachs, Morgan Stanley, J.P. Morgan, McKinsey, BCG, Bain, FT Partners, PitchBook, and Houlihan Lokey research published through Q4 2025 and Q1 2026, plus deal filings. Named third-party figures on this page trace to their sources: the Global Payments and FIS deal multiples per the April 16, 2025 announcement; subsector medians per Houlihan Lokey’s Q1 2026 FinTech Market Update; public comparables per stockanalysis.com (S&P Global) as of August 8 to 11, 2026; deal counts per The Strawhecker Group as reported by Payments Dive, July 20, 2026; residual portfolio ranges per 733Park’s published valuation guide and TSG’s attrition benchmarks. Revenue multiples are stated against net revenue unless marked gross. Private ranges are stated as ranges, not point estimates, because sample counts in individual cells of this market are thin; where a figure is a single-transaction marker rather than a distribution, it is labeled as such. Transaction dates are stated in every comp. This page is the canonical version of the Windsor Drake payments valuation report; the PDF edition is a supplementary download of the same data. Related research: fintech valuation multiples, the Fintech Exit Index, and EBITDA multiples by industry. Advisory: fintech M&A advisory.
Windsor Drake is a sell-side M&A advisory firm for founder-led fintech, B2B SaaS, cybersecurity, and AI software companies. Headquartered in Toronto.
Windsor Drake represents founders on the sell side only. Every inquiry is read and answered personally, usually within one business day, and every conversation is confidential and without obligation.
Discuss a potential saleWindsor Drake is not a registered broker-dealer and does not offer, sell or place securities.